
Note to Reader: Information in this Sector often includes the acronym HNHB LHIN, referring to the Hamilton Niagara Haldimand Brant Local Health Integration Network. Information about the HNHB LHIN can be found at: http://www.hnhblhin.on.ca/home.aspx
Substance Use Rates
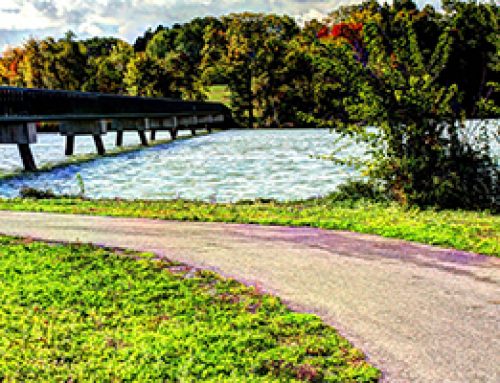
Smoking- Daily Smoking Rates
The rates of respondents reporting ‘current smoker, daily’ are the following:
Niagara Regional Area Health Unit (Health Region), Ontario
- Total: 15.6
- Male: 17.5
- Female: 13.8
The Niagara Region is somewhat lower than the rest of the HNHB LHIN.
Health Behaviours: Current Smoker, Daily (%) by Sex, 12 Years and Over, Niagara Regional Area Health Unit (Health Region), Ontario and Hamilton Niagara Haldimand Brant (Health Region), Ontario

Source: Canadian Community Health Survey, Statistics Canada
Retrieved From: http://www12.statcan.gc.ca/health-sante/82-228/details/page_Figure.cfm?Lang=E&Geo1=HR&Code1=3546&Geo2=HR&Code2=3504&Data=Rate&SearchText=Niagara
&SearchType=Contains&SearchPR=01&B1=All&Custom=&Profile=3000&Age=1&LineID=3085
Smoking – Second-Hand Smoke Exposure
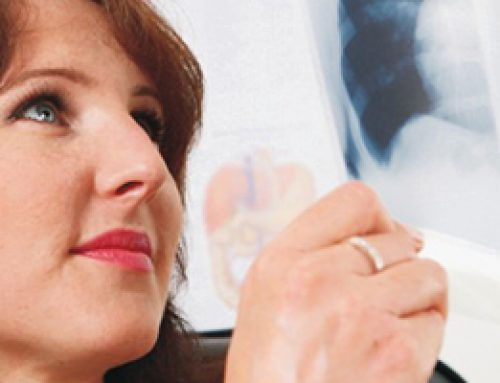
In a Statistics Canada report it was outlined that 5.2% of children 12 years and over were exposed to second hand smoke. This statistic is reported from a non-smoking population aged 12 and over who reported that at least one person smoked inside their home every day or almost every day.
Environmental Factors: Second-Hand Smoke, Exposure at Home (%) by Sex, 12 Years and Over, Niagara Regional Area Health Unit (Health Region), Ontario and Hamilton Niagara Haldimand Brant (Health Region), Ontario

The rates of respondents reporting ‘second-hand smoke, exposure at home’ are the following:
Niagara Regional Area Health Unit (Health Region), Ontario
- Total: 5.2 Note E: use with caution
- Male: 5.7 Note E: use with caution
- Female: 4.8 Note E: use with caution
Source: Canadian Community Health Survey, Statistics Canada, 2011/2012. CANSIM table no(s): 105-0502, 105-0592
Heavy Alcohol Consumption
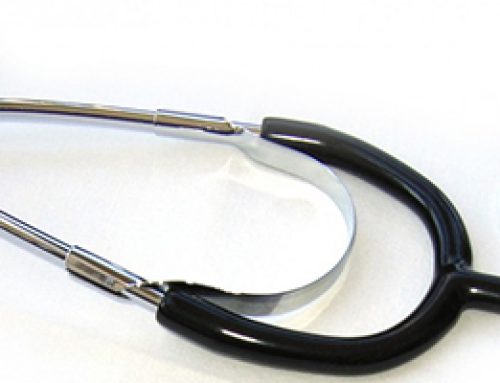
Heavy drinking refers to having consumed five or more drinks, per occasion, at least once a month during the past year. This level of alcohol consumption can have serious health and social consequences. 21.4% of individuals in this survey reported drinking that falls within this dimension.
Health Behaviours: Heavy Drinking (%) by Sex, 12 Years and Over, Niagara Regional Area Health Unit (Health Region), Ontario and Hamilton Niagara Haldimand Brant (Health Region), Ontario

Source: Canadian Community Health Survey, Statistics Canada, 2011/2012. CANSIM table no(s): 105-0502, 105-0592
Retrieved From: http://www12.statcan.gc.ca/health-sante/82-228/details/page_Figure.cfm?Lang=E&Geo1=HR&Code1=3546&Geo2=HR&Code2=3504&Data=Rate&SearchText=Niagara
&SearchType=Contains&SearchPR=01&B1=All&Custom=&Profile=3000&Age=1&LineID=3150
Youth Drug Use
A number of illicit drugs, as well as prescription drugs and over the counter medication are being used by youth. Niagara Region Public Health provides specific information on these rates, including that 37.7% of youth have used at least one type of drug in the past year.
Source: Niagara Region Public Health Unit
Retrieved from: https://www.niagararegion.ca/health/statistics/behaviour/youth-drugs.aspx
Physical Activity Rates
Physical activity rates provided by the Niagara Region Public Health Unit outline that 58.8% of Niagara Residents would rate themselves as active or moderately active, with 41.3% in 2011-2012 reporting being inactive. This is a significant measure to consider as inactivity and sedentary behaviors have been shown to lead to severe health conditions including obesity, heart disease and diabetes.
Table 1: Age-Standardized Self-Reported Percent of Niagara Residents (12+ years) Who Are Active or Moderately Active During Leisure Time
|
Year |
Percent (%) |
95% Confidence Interval |
|
2003 |
56.8 |
53.4-60.2 |
|
2005 |
54.2 |
50.8-57.6 |
|
2007-2008 |
58.1 |
54.7-61.5 |
|
2009-2010 |
59.6 |
55.4-63.7 |
|
2011-2012 |
58.8 |
54.5-63.2 |
Source: Public Health Ontario. Snapshots: Niagara Region Public Health: Self-reported rate of being active or moderately active during leisure time- age standardized rate (both sexes combined) 2003-2012. Toronto, ON: Ontario Agency for Health Protection and Promotion; 2013 Nov 20 [cited 2014 July 28].
Retrieved From: http://www.publichealthontario.ca/en/DataAndAnalytics/Snapshots/Pages/Health-Behaviours—Nutrition-and-Healthy-Weights.aspx
Table 2: Age-Standardized Self-Reported Percent of Niagara Residents (12+ Years) Who Are Inactive During Leisure Time
|
Year |
Percent (%) |
95% Confidence Interval |
|
2003 |
43.2 |
39.8-46.6 |
|
2005 |
45.8 |
42.4-49.2 |
|
2007-2008 |
41.9 |
38.2-45.3 |
|
2009-2010 |
40.4 |
36.3-44.6 |
|
2011-2012 |
41.2 |
36.8-45.5 |
Source: Public Health Ontario. Snapshots: Niagara Region Public Health: Self-reported rate of being inactive during leisure time- age standardized rate (both sexes combined) 2003-2012. Toronto, ON: Ontario Agency for Health Protection and Promotion; 2013 Nov 20 [cited 2014 July 28].
Retrieved From: http://www.publichealthontario.ca/en/DataAndAnalytics/Snapshots/Pages/Health-Behaviours—Nutrition-and-Healthy-Weights.aspx
Nutrition Rates
When Niagara residents were asked to report their consumption of vegetables it was found that only 38.5% reported they did consume the recommended 5 or more servings per day.
Table 3: Age-Standardized Self-Reported Percent of Niagara Residents (12+ Years) who Consume 5 or More Servings of Vegetables per day
|
Year |
Percent (%) |
95% Confidence Interval |
|
2003 |
40.2 |
35.8-44.5 |
|
2005 |
46.0 |
42.4-49.5 |
|
2007-2008 |
42.4 |
38.7-46.1 |
|
2009-2010 |
39.4 |
35.5-43.3 |
|
2011-2012 |
38.5 |
33.9-43.0 |
Source: Public Health Ontario. Snapshots: Niagara Region Public Health: Self-reported consumption of vegetables and fruits five or more times per day- age standardized rate (both sexes combined) 2003-2012. Toronto, ON: Ontario Agency for Health Protection and Promotion; 2013 Nov 20 [cited 2014 July 28].
Retrieved From: http://www.publichealthontario.ca/en/DataAndAnalytics/Snapshots/Pages/Health-Behaviours—Nutrition-and-Healthy-Weights.aspx
2011 Kindergarten Parent Survey – Nutrition Information
It is also important to highlight the findings of a survey conducted in 2011 with Kindergarden parents in Niagara. In this survey parents were asked to answer questions related to sleep, nutrition and physical activity. A summary of the data can be found on the Niagara Knowledge Exchange, by clicking on the “Retrieved From” link below.
A number of interesting findings were apparent in this report, including the fact that 85% of parents reported that their children did eat breakfast and 77% reported eating more than 4 fruits and vegetables daily most of the time or always. 99% of parents reported that their children had 8 or more hours of sleep each night. Interestingly, 74.3% of parents outlined that their children are either moderately active or passive.
Source: Niagara Region Public Health
Retrieved From: http://www.niagaraknowledgeexchange.com/resources-publications/kindergarten-parent-survey-2011/
Dental Health Rates
The following 2 tables outline the number of children who have been screened through the dental health program in Niagara which revealed the number of children with decayed, missing and filled teeth. The rate has increased over the past 4 years.
Table 1: Number and Proportion of Children in All Grades Assessed with Decay, Missing or Filled Teeth in the Niagara Region, 2010/2011-2013/2014 School Year
|
School Year |
# Children Screened in Dental Program |
# Children with Decay, Missing or Filled Teeth* |
% of Children with Decay, Missing, or Filled Teeth* |
|
2010/2011 |
22,667 |
7,979 |
35.2 |
|
2011/2012 |
23,850 |
7,954 |
33.3 |
|
2012/2013 |
23,427 |
8,339 |
35.5 |
|
2013/2014 |
23,116 |
8,886 |
38.4 |
Note: *The children in the table above represent those who have one or more teeth: with present decay,
missing, or filled at the time of school screening.
Source: OHISS 2010/2011-2013/2014
Table 2: Number and Proportion of Children in JK and SK Assessed with Decay, Missing or Filled Teeth in the Niagara Region, 2010/2011-2013/2014 School Year.
|
School Year |
# Children Screened in Dental Program |
# Children with Decay, Missing or Filled Teeth* |
% of Children with Decay, Missing, or Filled Teeth* |
|
2010/2011 |
6,381 |
1,748 |
27.4 |
|
2011/2012 |
7,260 |
1,903 |
26.2 |
|
2012/2013 |
7,051 |
2,048 |
29.0 |
|
2013/2014 |
7,344 |
2,103 |
28.6 |
Note: *The children in the tables above represent those who have one or more teeth with present decay, missing, or filling at the time of school screening.
Source: OHISS 2010/2011-2013/2014
More information on adult dental care and access to dental services can be found here.
Bridges Community Health Centre (Fort Erie and Port Colborne) released a Dental Health report in June, 2014, summarizing findings of a dental health survey completed by Bridges CHC clients.
“With no or limited coverage, and the inability to pay out of pocket for dental care, many people are left dealing with dental issues on a daily basis. Approximately 50% experience dental pain; close to half have missing, loose or broken teeth; 13% have abscesses and 23% have swollen or bleeding gums. No access to preventive and restorative care contributes to infections forcing 19% of respondents to visit urgent care or an emergency room for treatment. Respondents also indicated they dealt with dental emergencies on their own 7% of the time.”
Source: Bridges Community Health Centre
Retrieved From: http://www.niagaraknowledgeexchange.com/wp-content/uploads/sites/2/2014/07/BRIDGES_COMMUNITY_HEALTH_CENTRE_DENTAL_HEALTH_REPORT_June_2014.pdf