
Net Migration data about the rate of migration per 1,000 population was derived by comparing the addresses supplied on personal income tax returns filed in the spring of 2005 and 2006. Changes were adjusted to July 2005 total population estimates for selected Census Metropolitan Areas (CMAs). The rate represents the rate per 1,000 of the population who move out of an area to live somewhere else in a given period of time.
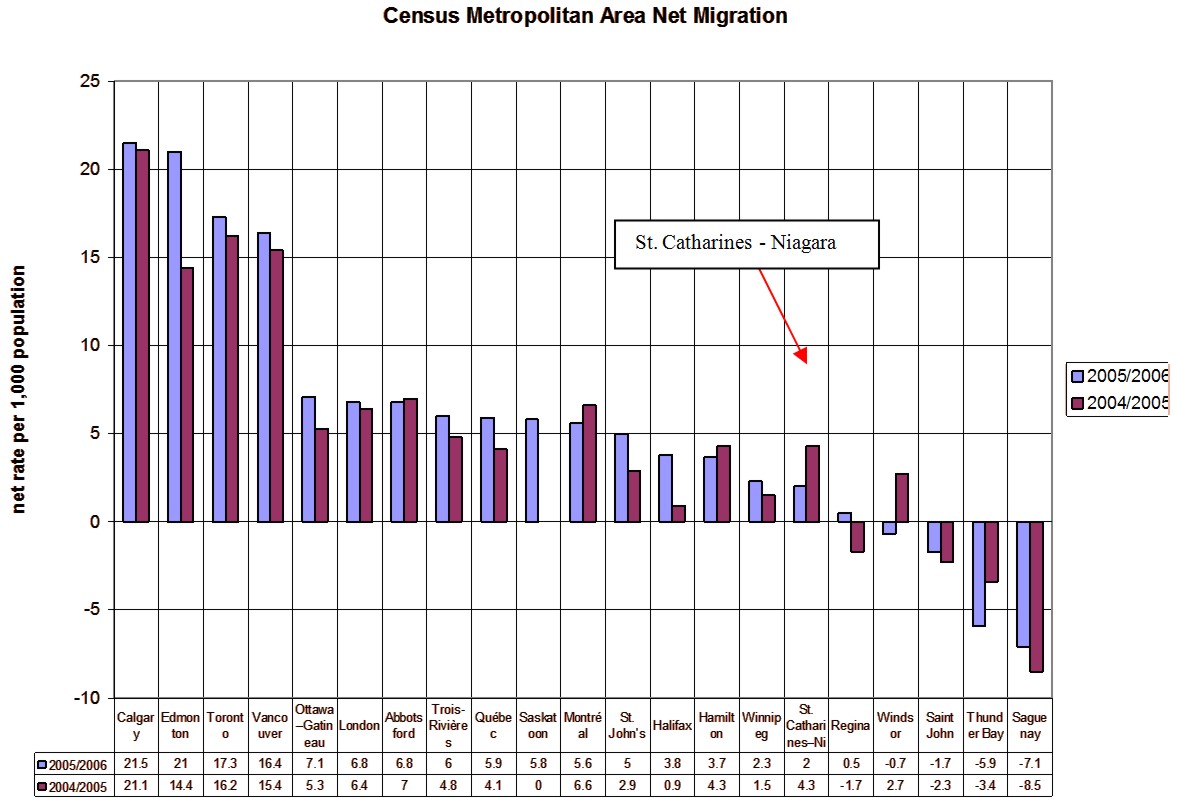
The migration rate for St. Catharine – Niagara CMA was lower compared to 21 other Canadian reporting larger metropolitan areas, and the rate went down from 4.2 per 1,000 population to 2 in the period of reporting from 2004/2005 to 2005/2006.
Figure 41 Census Metropolitan Area Net Migration

Source: http://www.statcan.ca/Daily/English/070927/d070927c.htm
Rating: 3
