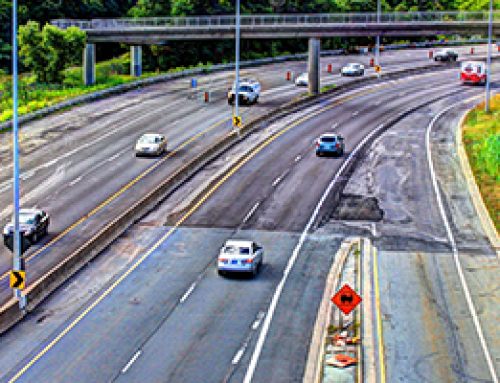
As ours has traditionally been a majority single vehicle travel society, understanding affordability and accessibility issues can assist us in thinking critically about what it means for the health and wellbeing of residents, our economy and our community to have equal opportunity to access affordable, acceptable transportation.
Cost of Gasoline
For those who drive automobiles, the rising cost of fuel affects affordability to travel for education and employment. Gasoline prices in Ontario went down in mid-2008 and then rose steadily, into 2011. From 2011 to 2014, gasoline prices levelled out between $1.19/Litre and $1.35/Litre.

Source: Historical Price Charts, Gasbuddy.com
Retrieved From: http://www.GasBuddy.com/gb_retail_price_chart.aspx?city1=Canada%20Average&city2=Ontario&city3=Toronto&crude=n&tme=108&units=ca
The cost and affordability of transit, especially for students and people living in poverty, affects people’s ability to travel for education, employment and access to health and human services.
Impact of Regional Transit on Rider Quality of Life
Impact of Regional Transit on Rider Quality of Life summarizes a 2013 survey of people riding the 6 pilot Niagara Region inter-municipal bus routes. The majority of the 190 respondents reported using transit as a reliable way to get to work, and cited its importance to them attaining work, being able to afford to get to work, and being able to advance in their employment. The research was completed by ‘Meetings on the Bus’ organizers.
Source: Personal correspondence with Meetings on the Bus organizers http://meetingsonthebus.tumblr.com/
Retrieved From: http://www.niagaraknowledgeexchange.com/resources-publications/impact-of-regional-transit-on-rider-quality-of-life/
Student Investment in and Use of Public Transit in Niagara
Brock University and Niagara College students are a seasonal group of Niagara residents who are paying fees for and utilizing transit in Niagara, thereby generating value for our region. Statistics that show only 2.8% of Niagara residents report using public transit probably underestimate the total, as they do not reflect numbers of students and tourists utilizing transit. Students often either live at home, or have moved into Niagara from out-of-region, and thus are not captured in census data. The perception of ridership rates being at only 2.8% discounts the value of and necessity for a seamless transit system in the region.
The bus pass for Brock University is a mandatory fee for all full time undergraduate students. With around 18,000 students paying this bus fee, Brock University Students’ Union contributes a substantial amount toward public transit service in the Niagara Region. The bus pass offered by Niagara College is also a mandatory fee that all 10,000 full-time students pay as part of their tuition.
Of the approximately 28,000 post-secondary students using public transit regularly through the primary school months (September-May, excluding December), it is estimated that 2/3 of student ridership consists of Brock students, while the other 1/3 are Niagara College students.
Approximately $6 million dollars in total between Niagara College and Brock University students is paid annually for transit in Niagara.
Source: Key Stakeholder Perspective on Seamless Transportation in Niagara – Joint presentation to Niagara Region Council by Brock University Students’ Union and Niagara College Student Administrative Council
Retrieved From: http://www.niagaraknowledgeexchange.com/transportation-mobility/key-stakeholder-perspective-on-seamless-transit-in-niagara/
Use of Buses and Public Transportation
The different points of transportation accessibility to and from and within Niagara are gateways of mobility for tourists, travelers, and residents.
Air
There are 4 local airports in the Niagara Region, in Niagara-on-the-Lake, Niagara Falls, Fort Erie and Port Colborne (Wainfleet).
The following table shows that air travel in Niagara has been declining in recent years.

Source: “Total aircraft movements by class of operation.” Statistics Canada
Retrieved From: http://www.statcan.gc.ca/pub/51-210-x/2013001/t001-eng.htm
Rail
VIA Rail/Amtrak offers train and bus service options to get from Toronto to Niagara Falls and return, in partnership with GO Transit (trains and buses). Weekdays, there are up to 9 departures per day and up to 7 departures on weekends.
Source: VIA Rail
Retrieved From: http://www.viarail.ca/en/explore-our-destinations/trains/ontario-and-quebec/toronto-niagara-falls
Trillium Railway is a local short line railway operating company, running the Port Colborne Harbour Railway (PCHR) since 1997. The PCHR serves 19 customers in Port Colborne, Welland, Thorold and St. Catharines, on a 50km long network. Through interchange with Canadian National Railway (CN) and Canadian Pacific Railway (CPR), customers are connected to the North American railway network. Principle commodities handled include wheat, mustard seed, scrap metal, wood pulp, bauxite, corn syrup & sweeteners, citric acid, steam boilers and vessels, steel billet, pipe and fabricated steel parts.
Source: Trillium Railway Company Ltd.
Retrieved From: www.trilliumrailway.com
Bus Service and GO Bus and Train
Both Greyhound and Coach Canada provide a number of routes to and from Niagara each day.
A total of 15 GO buses a day run from Niagara to Toronto & return.
Source: GO Transit
Retrieved From: http://www.gotransit.com/timetables/en/schedules/schedules_window.aspx?tableid=12&dir=E&date=2014-10-06&corridorname=Niagara%20Falls/Toronto%20Bus&parentid=1
GO Transit reports the following estimated ridership statistics for 2013 for Niagara train and bus service:
GO Train Ridership:
For the 2013 full season (Victoria Day + Canada Day to Labour day + Thanksgiving), GO operated 223 train trips and had a ridership of approximately 21,400 rail passengers.
For the 2013 core season (Canada Day to Labour Day), GO operated 177 train trips and had a ridership of approximately 18,300 rail passengers.
GO Bus Ridership:
Weekdays (2013) – Approximately 35 trips and 800 passengers per week day
Weekends (2013) – Approximately 32 trips and 1,000 passengers per weekend day
Source: GO Transit Customer Relations
Retrieved From: Personal correspondence via customerrelations@gotransit.com
2009 Ridership Forecast is a Niagara-focused Appendix document prepared for GO Transit as part of a 2009 GO Rail Expansion Feasibility Study showing that there are about 20,000 daily person trips in each direction that are Niagara-based, and future estimates look to be about 27,000 daily trips.
Source: GO Train Ridership forecast, 2009; Service to Niagara Peninsula Rail Expansion Feasibility Study, March, 2009
Retrieved From: http://www.gotransit.com/public/en/improve/Niagara%20docs/Niagara%20Appendices/Niagara_Appendix_A.pdf
Expanded GO Train service is expected to begin in Niagara between 2015 and 2017. Niagara leaders are advocating for this service to be in place in time for the PAN AM 2015 games, which are based in Toronto and include two Niagara-based venues: Rowing in St. Catharines; and Canoe/Kayak sprint events in Welland.
@GetNiagaraGOing is the handle of a Twitter campaign mounted leading up to the 2014 provincial election, to increase provincial political support for regular GO Train Service being established by 2015.
Source and Retrieved From: https://twitter.com/GetNiagaraGOing
“Its time to Get Niagara GOing” is a Youtube video posted in September, 2014 that outlines the significant economic impact that 2 round trip trains a day running between Toronto and Niagara Falls would have, for Niagara and Ontario.
Retrieved From: https://www.youtube.com/watch?v=8rv8IHPwejQ&feature=youtu.be
Boat
Sugarloaf Marina Transient Rates:
Sugarloaf, the largest marina on Lake Erie in Niagara, serviced 730 transients in 2012 and 569 in 2013. The total days stayed by guests were 2147 and 1476 respectively.
Source: Sugarloaf Marina Transient Stats, 2012 – 2013
Retrieved From: E-mail correspondence with Mark Minor, Assistant Manager, Sugarloaf Harbour Marina

Marinas in Niagara
Source: Google Maps
Retrieved From: https://mapsengine.google.com/map/edit?mid=zjmp0-4FTq4s.kL0ZNBqn0RHg
Niagara Poverty Reduction Network (NPRN) Transportation Working Group
The NPRN is a group of over 30 agencies and individuals in Niagara that is “Working collectively to wipe out poverty in Niagara through information sharing, changing attitudes, and compelling Niagara citizens to get involved and take action.”
The NPRN Transportation Working Group is:
A group of representatives from various community agencies who recognize that transportation issues (access to reliable and affordable systems) are a competitive and economic driver issue for this region, and are frequently cited as a barrier for people with lived experience. Areas of focus include:
- Supporting and helping with the promotion of the Region’s intermunicipal transit pilot
- Local transit issues
- Supporting active transportation initiatives
Source: Niagara Poverty Reduction Network
Retrieved From: http://www.wipeoutpoverty.ca/#!transportation-working-group/ccut
Development of a Model for Centrally-Dispatched Access to Health and Human Services by Niagara’s most Vulnerable People
A working group of 30 Niagara agencies has gathered building blocks and is developing a business model for a “Getting There” consortium approach to building centrally-dispatched access to health and human services for Niagara’s most vulnerable people. Building Blocks include: Central dispatch technology; Vehicle Fleet (leveraging already-existing Niagara community and transit assets); and Engaged Agencies and Points of Service, with a common denominator of providing access to services for vulnerable people.
The environmental scan to inform this work included gathering information from the Information Niagara database about already-existing specialized transit and agency transportation services in Niagara, including:
FAST – Fort Erie Accessible Specialized Transit
http://niagara.cioc.ca/record/NIA0569?UseCICVw=115&Number=4
Regional Municipality of Niagara, Specialized Transit (NST) (est. Nov. 2006)
http://niagara.cioc.ca/record/NIA1418?UseCICVw=115&Number=9
City of Welland – WellTrans
http://niagara.cioc.ca/record/NIA0612?UseCICVw=115&Number=1
Niagara Chair-A-Van (Niagara Falls)
http://niagara.cioc.ca/record/NIA0137?UseCICVw=115&Number=6
Paratransit System of St. Catharines – Transportation for the Physically Challenged
http://niagara.cioc.ca/record/NIA0287?UseCICVw=115&Number=13
Central Taxi Co Inc – Transportation for People with Disabilities
http://niagara.cioc.ca/record/NIA3958?UseCICVw=115&Number=0
Elite Taxi Ltd – Paratransit Services
http://niagara.cioc.ca/record/NIA0710?UseCICVw=115&Number=3
Raham’s Transportation
http://niagara.cioc.ca/record/NIA1327?UseCICVw=115&Number=14
Canadian Cancer Society – Niagara Unit
http://niagara.cioc.ca/record/NIA0373?UseCICVw=115&Number=0
Community Support Services of Niagara – St. Catharines, Welland, West Niagara
http://niagara.cioc.ca/record/NIA0004?UseCICVw=115&Number=4
Family and Children’s Services Niagara (FACS)
http://niagara.cioc.ca/record/NIA0944?UseCICVw=115&Number=7
Metis Nation of Ontario – Community Support Service, Welland Council
http://niagara.cioc.ca/record/NIA5632?UseCICVw=115&Number=12
Pelham Cares Inc
http://niagara.cioc.ca/record/NIA0297?UseCICVw=115&Number=16
Source: Niagara Connects
Retrieved From: http://www.niagaraknowledgeexchange.com/resources-publications/getting-there-access-to-health-human-services-for-niagaras-most-vulnerable/
Commuting and Distances to Work
Statistics Canada data shows that Niagara is dominated by the automobile as a mode of transportation. Thus, road maintenance is a significant budget priority for local governments. Public transit ridership numbers are lower in Niagara than for Ontario. It is important to note that these numbers do not reflect students who regularly use the bus to commute to Brock University or Niagara College campuses in Welland and Niagara-on-the-Lake. Including those numbers might give a better picture of transit use and proliferation in Niagara.
The following Statistics Canada table for the St. Catharines-Niagara CMA (does not include Grimsby and West Lincoln) displays the proportion of workers commuting to work by car, according to the 2011 National Household Survey.
Note: Due to changes in the way Statistics Canada gathered data in 2011, there was a ‘global non-response rate’ of 28.6%, affecting the reliability of this data.
The information is grouped by census metropolitan area (appearing as row headers), car, truck or van (total), car, truck or van (driver), car, truck or van (passenger), public transit, walking and bicycle, calculated using percentage units of measure (appearing as column headers).
Proportion of workers commuting to work by car, truck or van, by public transit, on foot, or by bicycle, St. Catharines-Niagara census metropolitan (CMA) area, 2011
(Note: CMA does not include Grimsby and West Lincoln)

Date modified: 2013-05-24
Retrieved From: http://www12.statcan.gc.ca/nhs-enm/2011/as-sa/99-012-x/2011003/tbl/tbl1a-eng.cfm

National Household Survey Data Footnote 96
National Household Survey Data Footnote 97
Source: Statistics Canada, National Household Survey, 2011
Retrieved From: http://www12.statcan.gc.ca/nhs-enm/2011/dp-pd/prof/details/page.cfm?Lang=E&Geo1=CD&Code1=3526&Data=Count&SearchText=Niagara&SearchType=Begins&SearchPR=01&A1=Labour&B1=All&Custom=&TABID=1#tabs1

National Household Survey Data Footnote 95
Source: Statistics Canada National Household Survey, 2011
Retrieved From: http://www12.statcan.gc.ca/nhs-enm/2011/dp-pd/prof/details/page.cfm?Lang=E&Geo1=CD&Code1=3526&Data=Count&SearchText=Niagara&SearchType=Begins&SearchPR=01&A1=Labour&B1=All&Custom=&TABID=1
Transportation Tomorrow Survey (TTS)
The TTS is the largest and most comprehensive travel survey ever conducted in Ontario. It is conducted by the Department of Civil Engineering at the University of Toronto. TTS data contains detailed demographic on all members of a surveyed household and a ledger of travel information over an entire weekday.
The 2011 TTS was conducted on behalf of 23 local, regional, provincial and transit operating agencies in the Greater Toronto and surrounding regions, including the Regional Municipality of Niagara.
The 2011 report for the total TTS Survey Area is available for download at this link:
http://www.dmg.utoronto.ca/pdf/tts/2011/regional_travel_summaries/TTS_report4_full.pdf
The 2011 report for the Regional Municipality of Niagara is available for download at this link:
http://www.dmg.utoronto.ca/pdf/tts/2011/regional_travel_summaries/Niagara.pdf
Active Transportation and Cycling in Niagara
Active Transportation is a topic of increasing importance in Niagara.
According to the Public Health Agency of Canada, Active Transportation refers to any form of human-powered transportation – walking, cycling, using a wheelchair, in-line skating or skateboarding. There are many ways to engage in active transportation, whether it is walking to the bus stop, or cycling to school/work.
Active transportation includes many active modes and methods of travel such as:
- walking/jogging/running;
- cycling;
- in-line skating;
- skateboarding;
- non-mechanized wheelchairing; and
- snowshoeing/skiing.
There are numerous benefits from active transportation:
- Health – Active transportation provides an opportunity to be physically active on a regular basis.
- Social – Active transportation is accessible to Canadians and increases social interactions.
- Transportation – Active transportation reduces road congestion.
- Environmental – Active transportation is environmentally-friendly and can contribute to reductions in greenhouse gas emissions.
- Economic – Active transportation saves money on gas and parking.
Source: Public Health Agency of Canada
Retrieved From: http://www.phac-aspc.gc.ca/hp-ps/hl-mvs/pa-ap/at-ta-eng.php
Cycling Routes and Bike Friendly Planning
Cycling for pleasure and fitness is growing in popularity; so is cycling tourism. The presence of official multi-use trails in Niagara, cycle-friendly municipal planning and growth in cycling tourism are all indications of the impact active transportation is having on Niagara.
Kilometers of Multi-Use Trails in Niagara
Examining investments made into sustainable and safe multi-use trails is an indicator of Niagara’s willingness to build a cycle-friendly region for the future. The work that has been done so far has given cyclists a safe place to ride without fear of traffic.
According to Niagara Region’s comprehensive bike map of the region, there are about 282.2km of official trails in Niagara. These trails are mostly off of the road, away from street traffic, and connect all the municipalities together.
Source: Niagara Region
Retrieved From: http://www.niagaraknowledgeexchange.com/resources-publications/niagara-region-bicycling-map/
Bike Friendly Municipalities are designated by the Share the Road Cycling Coalition. Of Ontario’s 444 municipalities, 24 have received this status. Of those 24, Niagara Region has 5 local municipalities that have designations:
Pelham – Silver
Grimsby – Bronze
Thorold – Bronze
Welland – Bronze
St. Catharines – Bronze
Cycling Tourism is growing in Niagara, according to Venture Niagara. A May, 2014 presentation cites 2010 research, Transportation Options. Economic Impact of Cycle Tourism: Niagara Region and Greenbelt Areas, Summer 2010 cites significant economic impact of visitors participating in cycling activities in Ontario.
#CycleON, Ontario’s Cycling Strategy is investing $25 million in bike infrastructure funding to help municipalities expand cycling routes and fund pilot programs including building cycling infrastructure on provincial highways and bridges.
Source: Venture Niagara, Niagara Cycling Tourism Slide Presentation, May 5, 2014
Retrieved From: http://www.niagaraknowledgeexchange.com/resources-publications/niagara-cycling-tourism/
Cycling Tourism in Niagara Parks is a 2013 policy brief prepared for the Niagara Parks Commission that outlines the importance for Niagara of opportunities around being a “Cycle Friendly” community. In particular, it cites:
Cyclists spend more money per occasion than those individuals arriving by vehicle.
- In 2010, some 84,000 cycle tourists visited Niagara Region, ranked third in Ontario behind Toronto (223,000 cycle tourists) and Ottawa (110,000 cycle tourists). In all, cycle tourism contributed $104 million to the Ontario economy in 2010 (Transportation Options 2012).
- Cycle tourists staying one or more nights in Niagara spend an average $148, excluding accommodation (Transportation Options 2012) while $108 is the average spent by all Niagara cyclists when including day-trippers (Transportation Options 2010)
- Bicycle tourists look for activities and sites of interest to visit along any trails or paths.
- Bicycling infrastructure is relatively inexpensive. Example, the cost of one bicycle parking spot is approximately five per cent the cost of building one car parking spot.
- Becoming bike-friendly can attract new customers as businesses that have pursued this have found up to one-third of their customers are now cyclists.
Source: Niagara Community Observatory at Brock University, Policy Brief #17, November 2013, Cycle Tourism in Niagara Parks
Retrieved From: http://www.niagaraknowledgeexchange.com/transportation-mobility/cycle-tourism-in-niagara-parks/
Public Electric Vehicle Charging Stations in Niagara
The market for Electric Vehicles (EV’s) is growing across North America. Many of the major auto manufacturers have all-electric or electric-hybrid options for sale. Thus, it is important to note the presence of EV infrastructure in Niagara, for both local residents and visitors to utilize. Statistics about how many Niagara residents have an EV, and numbers of visitors coming to Niagara with an EV would further illuminate this topic.
The current infrastructure for EV’s in Niagara is developing. There are a few publicly accessible stations, with most requiring a stay at a hotel, eating at an EV equipped restaurant or having a parking pass (such as at Brock University). Several areas of the region do not have EV coverage, meaning that residents with electric or hybrid cars can only recharge at home.
Currently, Niagara has 17 registered EV charging stations, according to the Canadian Automobile Association (CAA) Niagara. The vast majority of chargers (14/17) are located in St. Catharines and Niagara Falls. The southern tier has two, one in Welland and one in Fort Erie. The only charger in West Niagara is located in Grimsby, near the QEW.

Locations of EV Charging Stations
Insurance Broker – 1 location
Car Dealership – 1 location
Hotel Chain – 7 locations
Historical Site – 2 locations
University – 1 location
Restaurant – 3 locations
Casino – 1 location
Small Business – 1 location
Source: CAA Niagara
Retrieved From: http://www.caa.ca/evstations/ (Keyword Search: Niagara)


