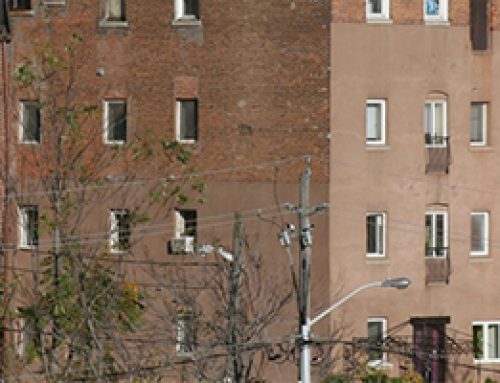
Niagara has more than 7,500 units of affordable housing through Niagara Regional Housing, non-profits and cooperatives, the Rent Supplement Program and the Housing Allowance Program.
Source: Niagara Regional Housing
Retrieved From: http://www.nrh.ca/scripts/find-a-unit.pl
Housing Demand Trends
In prior versions of this report, this measure was listed as an indicator called ‘Variety of Housing’.
Canadian Housing Observer, Housing Market Indicators, St. Catharines – Niagara, 1990–2012 is a spread sheet from the Canadian Mortgage and Housing Corporation (CMHC) that looks at trends in housing in the St. Catharines-Niagara CMA* over 12 years. It includes the amount of housing being built, supply available and demand to be met.
(*Census Metropolitan Area – does not include Grimsby and West Lincoln)
Source: CMHC Canadian Housing Observer, Housing Market Indicators, St. Catharines – Niagara, 1990–2012
Retrieved From: http://www.niagaraknowledgeexchange.com/resources-publications/housing-market-indicators-st-catharines-niagara/
New Housing Starts
In prior versions of this report, this measure was listed as an indicator called ‘Housing starts and the building industry’.
The July 2014 CMHC New Housing Construction Activity report for the St. Catharines-Niagara CMA compares year over year seasonally adjusted new housing starts data.
Source: CMHC
Retrieved from: https://www03.cmhc-schl.gc.ca/hmiportal/en/#Profile/1160/3/St.%20Catharines-Niagara
Vacancy Rates
In prior versions of this report, this measure was listed as an indicator called ‘Vacancy Rates in Niagara’.
The vacancy rate speaks to the availability of housing and can influence pricing. That is, a higher vacancy rate leads to lower rental/purchase prices for housing; the opposite holds true for low vacancy rates. Also, with higher vacancy rates there is less difficulty in finding a place to live, while lower vacancy rates lower the pool of housing options from which to choose.
The following figure showcases the vacancy rate of major Ontario regions (including Niagara).

Figure 1 page 1 of the Canada Mortgage and Housing Corporation Fall 2013 Rental Market report – Ontario Highlights compares vacancy rates among major Ontario centres, including the St. Catharines-Niagara census metropolitan area (CMA)
Source: CMHC
Retrieved From: http://www.niagaraknowledgeexchange.com/resources-publications/rental-market-report-ontario-highlights/
Page 4 of the same document displays the current trend for vacancy rates in different Ontario regions (i.e. increasing, decreasing or stable).
The CMHC’s online profile of Housing in Niagara Region makes the following statement about vacancy rates in Niagara:
“Vacancy rate and availability
In Niagara, the vacancy rate for one bedroom rental apartments was 3.3 per cent and for two bedroom apartments was 3.5 per cent. The vacancy rate of three bedroom rental apartments was 4.5 per cent. This was the proportion of rental apartments that are vacant and ready for move-in in April 2013.
The proportion, in April 2013, of apartments that are vacant or for which the present occupant has given notice to move-out was 5 per cent for one bedroom apartments, 5.6 per cent for two bedroom apartments, and 7.7 per cent for three bedroom apartments.”
Source: CMHC
Retrieved From: http://www.cmhc-schl.gc.ca/en/co/buho/seca/nire/nire_002.cfm


