Sense of community belonging refers to how one identifies with their community, and how it impacts them as a result. It is different than participation in community activities and events.
Statistics Canada states that research shows a high correlation of sense of community belonging with physical and mental health.
Table 1. Population Aged 12 and Over who Reported their Sense of Belonging to their Local Community as Being Very Strong or Somewhat Strong.
“Research shows a high correlation of sense of community-belonging with physical and mental health.” (Statistics Canada)
|
Geography |
Sex |
2007 |
2008 |
2009 |
2010 |
2011 |
2012 |
|
Canada |
Both sexes |
64.6 |
65.0 |
65.4 |
65.4 |
64.8 |
66.1 |
|
Males |
63.9 |
65.0 |
64.5 |
64.6 |
63.0 |
65.8 |
|
|
Females |
65.4 |
64.9 |
66.2 |
66.2 |
66.6 |
66.4 |
|
|
Ontario by Health Unit |
Both sexes |
65.5 |
67.3 |
67.1 |
67.7 |
67.0 |
68.2 |
|
Males |
64.6 |
67.6 |
65.9 |
66.6 |
65.7 |
67.5 |
|
|
Females |
66.4 |
67.0 |
68.4 |
68.8 |
68.1 |
68.7 |
|
|
Niagara Regional Area Health Unit, Ontario |
Both sexes |
68.9 |
67.8 |
73.1 |
68.0 |
65.8 |
73.7 |
|
Males |
69.2 |
64.9 |
72.8 |
69.6 |
63.5 |
75.2 |
|
|
Females |
68.7 |
70.4 |
73.4 |
66.5 |
67.9 |
72.3 |
Table 2
This is a different version of the same information provided in Table 1. Values are for the Niagara Regional Area Health Unit. (Statistics Canada)
|
Characteristics |
2007-2008 |
2009-2010 |
2011-2012 |
|
Number of persons |
245,762 |
261,174 |
258,829 |
|
Percent |
68.3 |
70.6 |
69.8 |
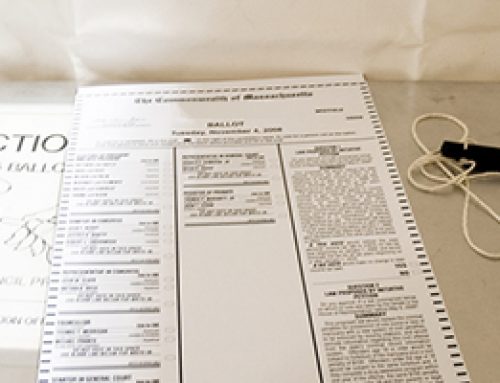
Figure 1: Sense of Community Belonging (%) by Sex, 12 Years and Over, Niagara Regional Area Health Unit (Health Region) and Ontario for 2013 (Statistics Canada, 2013)

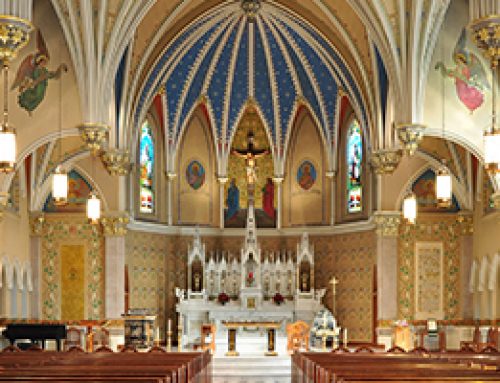
Figure 2: Personal Resources: Sense of Community Belonging (%) by Sex, 12 Years and Over, Niagara Regional Area Health Unit (Health Region), and Canada for 2013. (Statistics Canada, 2013)

Above Data Retrieved From:
http://www5.statcan.gc.ca/cansim/a26?lang=eng&retrLang=eng&id=1050502&pattern=&csid=