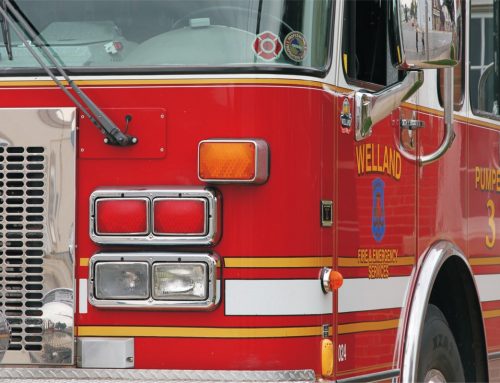
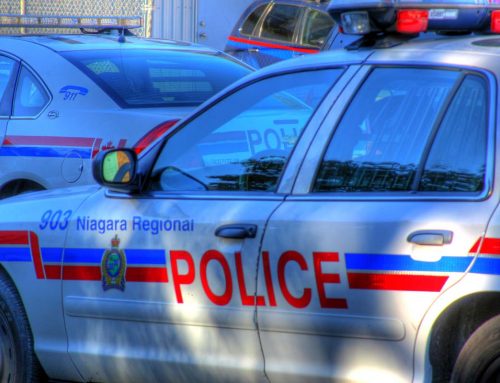
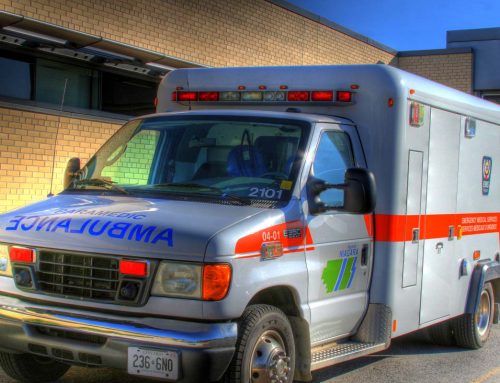
Niagara has targeted drinking and driving with public education campaigns and the Reduce Impaired Driving Everywhere (RIDE) initiatives since the 1970s. The impaired driving rates for alcohol and drugs have decreased from higher rates in 2003 and 2004 and are lower than Ontario and Canadian rates.

Adapted from Statistics Canada CANSIM Table 252-0051
Table 6.5 Impaired Driving Total Reported Rates (Alcohol and Drug) per 100,000 population
|
2003
|
2004
|
2005
|
2006
|
2007
|
2008
|
2009
|
| Canada |
245.4
|
251.53
|
243.04
|
233.69
|
241.09
|
254.13
|
262.69
|
| Ontario |
155
|
147.28
|
142.86
|
140.04
|
139.92
|
144.96
|
138.72
|
| Kingston,Ontario |
115.03
|
102.99
|
115.44
|
94.75
|
103.54
|
95.84
|
97.69
|
| Hamilton |
105.97
|
100.91
|
87.86
|
86.58
|
91.46
|
122.96
|
127.42
|
| St.Catharines-Niagara |
178.17
|
169.08
|
135.36
|
107.33
|
126.17
|
123.55
|
166.4
|
| Kitchener |
144.8
|
138.58
|
137.82
|
135.94
|
143.83
|
146.59
|
135.28
|
| Windsor |
127.04
|
115.78
|
124.32
|
114.82
|
115.3
|
95.66
|
105.22
|
| Sudbury |
111.22
|
103.01
|
112.07
|
111.12
|
126.76
|
121.56
|
117.64
|
|
| Source: Adapted from Statistics Canada: CANSIM Table 252-0051
|
Use the icons below to Share!


